Table 15-1
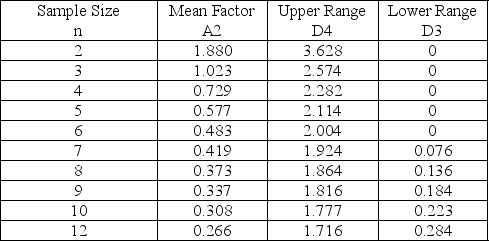
-Use the data shown below and the information in Table 15-1 to develop an upper control limit for a control chart that monitors consistency.What is the upper control limit? 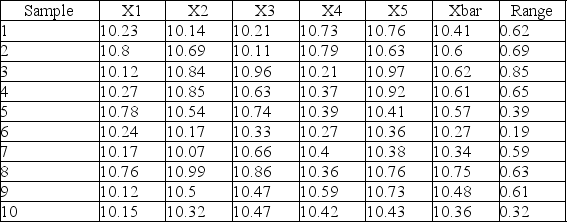
A) 2.11
B) 6.38
C) 10.82
D) 1.17
Correct Answer:
Verified
Q63: Table 15-2
Given the sample results (100 units
Q64: A company has been receiving complaints about
Q65: Which of these patterns on a control
Q66: The c-chart is useful when we
A)take a
Q67: A company has been receiving complaints about
Q69: A company has been receiving complaints about
Q70: The mean of a process can be
Q71: Baker studied his control chart and noticed
Q72: Which of these patterns on a control
Q73: A company has been receiving complaints about
Unlock this Answer For Free Now!
View this answer and more for free by performing one of the following actions

Scan the QR code to install the App and get 2 free unlocks

Unlock quizzes for free by uploading documents