Table 14-6
The following data consists of a matrix of transition probabilities (P) of four majors in the College of Business, and the initial proportion of students in each major π(0) .Assume that each state represents a major and the transition probabilities represent changes from one major to the next after taking the introductory class in each discipline.
P =
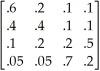
π(0) = (.4, .3, .2, .1)
-Using the data in Table 14-6, which major will end up with the greatest proportion of students?
A) Major 1
B) Major 2
C) Major 3
D) Major 4
Correct Answer:
Verified
Q59: A state that when entered, cannot be
Q60: In the long run, in Markov analysis
A)all
Q61: Table 14-4
Cuthbert Wylinghauser is a scheduler of
Q62: Table 14-4
Cuthbert Wylinghauser is a scheduler of
Q63: Table 14-5
The following data consists of a
Q65: Table 14-3
The following data consists of a
Q66: Table 14-2
The following data consists of a
Q67: Table 14-5
The following data consists of a
Q68: Table 14-3
The following data consists of a
Q69: Table 14-3
The following data consists of a
Unlock this Answer For Free Now!
View this answer and more for free by performing one of the following actions

Scan the QR code to install the App and get 2 free unlocks

Unlock quizzes for free by uploading documents