Multiple Choice
Table 16-1 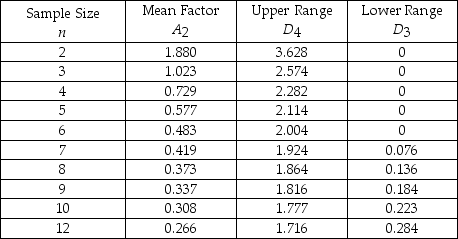
-Refer to Table 16-1. The average range of a process for packaging cereal is 1.1 ounces. If the sample size is 10, find the upper control chart limit for the range chart.
A) 0.245
B) 1.955
C) 1.777
D) 0.223
E) None of the above
Correct Answer:
Verified
Related Questions
Q14: Statistical process control uses regression and other
Q22: R-charts measure changes in
A)central tendency.
B)degree of variation.
C)number

