Multiple Choice
Table 16-1 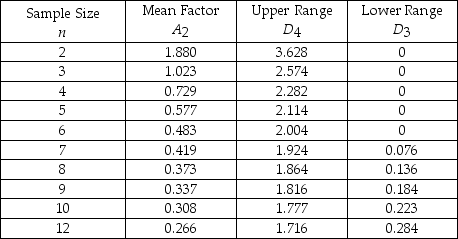
-Refer to Table 16-1. The average range of a process for packaging cereal is 1.1 ounces. If the sample size is 10, find the lower control chart limit for the range chart.
A) 0.245
B) 1.955
C) 1.777
D) 0.223
E) None of the above
Correct Answer:
Verified
Related Questions
Q25: Table 16-1 Q28: The p-chart would be useful when we![]()
A)took

