Use the data shown below to answer the following question(s).
The table below is the data set of the Shiller Real Home Price Index for the years 1985-2000. 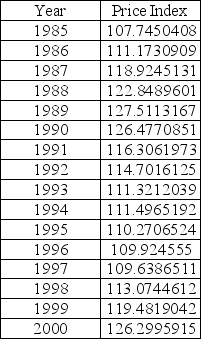
-Setting k = 3,determine the value of the mean square of errors.
Correct Answer:
Verified
View Answer
Unlock this answer now
Get Access to more Verified Answers free of charge
Q78: Use the data shown below to answer
Q79: A seasonal effect is one that repeats
Q80: In the Delphi method,the forecast is obtained
Q81: If a time series has a trend
Q82: Use the data shown below to answer
Q84: Use the data shown below to answer
Q85: Use the data shown below to answer
Q86: Holt-Winters' forecasting models are examples of qualitative
Q87: Use the data shown below to answer
Q88: Use the data shown below to answer
Unlock this Answer For Free Now!
View this answer and more for free by performing one of the following actions

Scan the QR code to install the App and get 2 free unlocks

Unlock quizzes for free by uploading documents