Use the data shown below to answer the following question(s).
The table below is the data set of the Shiller Real Home Price Index for the years 1985-2000. 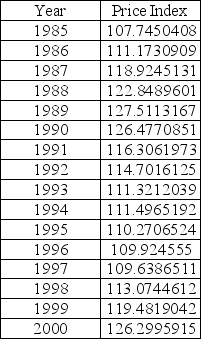
-Setting k = 3,determine the value of the root mean square of errors.
Correct Answer:
Verified
View Answer
Unlock this answer now
Get Access to more Verified Answers free of charge
Q83: Use the data shown below to answer
Q84: Use the data shown below to answer
Q85: Use the data shown below to answer
Q86: Holt-Winters' forecasting models are examples of qualitative
Q87: Use the data shown below to answer
Q89: Use the data shown below to answer
Q90: If a time series has a trend
Q91: Briefly explain the simple exponential smoothing model
Q92: In the double forecasting model Ft +
Q93: In the double forecasting model Ft +
Unlock this Answer For Free Now!
View this answer and more for free by performing one of the following actions

Scan the QR code to install the App and get 2 free unlocks

Unlock quizzes for free by uploading documents