Beef prices throughout the year (month 1 = January)are shown in the line chart below (per pound).Describe beef prices for this given year using this line chart. 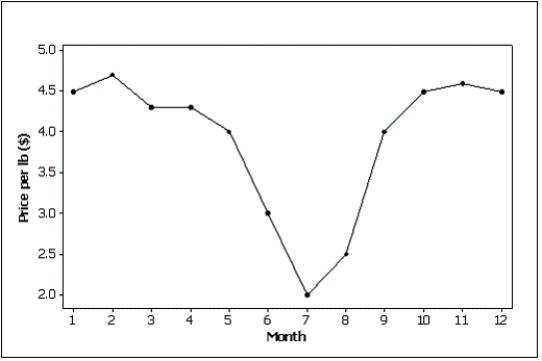
Correct Answer:
Verified
View Answer
Unlock this answer now
Get Access to more Verified Answers free of charge
Q7: Time series data are often graphically depicted
Q55: A line chart is created by plotting
Q64: A(n)_ is created by plotting the value
Q70: Observations that are measured at successive points
Q76: Which of the following statements describes a
Q79: What kind(s)of data can be depicted by
Q84: If two variables have a strong linear
Q89: The graphical technique used to describe the
Q103: The scatter diagram below depicts data with
Q105: Data for calories and salt content (milligrams
Unlock this Answer For Free Now!
View this answer and more for free by performing one of the following actions

Scan the QR code to install the App and get 2 free unlocks

Unlock quizzes for free by uploading documents