The scatter diagram below depicts data with a negative linear relationship. 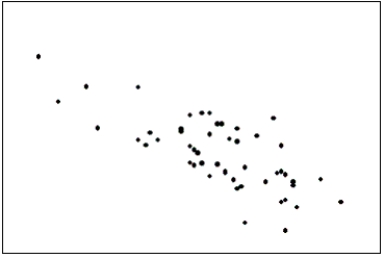
Correct Answer:
Verified
Q7: Time series data are often graphically depicted
Q55: A line chart is created by plotting
Q64: A(n)_ is created by plotting the value
Q66: A line chart is created by plotting
Q76: Which of the following statements describes a
Q84: If two variables have a strong linear
Q87: In order to draw a scatter diagram,we
Q89: The graphical technique used to describe the
Q101: Beef prices throughout the year (month 1
Q105: Data for calories and salt content (milligrams
Unlock this Answer For Free Now!
View this answer and more for free by performing one of the following actions

Scan the QR code to install the App and get 2 free unlocks

Unlock quizzes for free by uploading documents