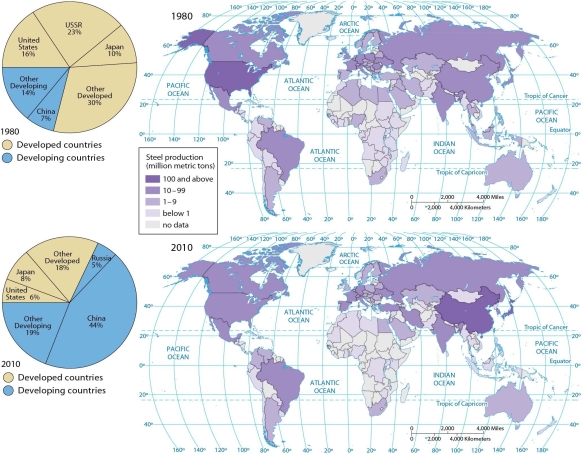
-According to these charts, the U.S. share of global steel production
A) decreased from 30 percent in 1980 to 18 percent in 2010.
B) decreased from 44 percent in 1980 to 7 percent in 2010.
C) increased from 16 percent in 1980 to 19 percent in 2010.
D) decreased from 16 percent in 1980 to 8 percent in 2010.
E) decreased from 16 percent in 1980 to 6 percent in 2010.
Correct Answer:
Verified
Q43: A company which uses more than one
Q44: Q45: In order to become a global industrial Q46: Q47: As a country's per capita income increases, Q49: Containerization was developed to facilitate long-distance transport Q50: Despite the risks to the environment, the Unlock this Answer For Free Now! View this answer and more for free by performing one of the following actions Scan the QR code to install the App and get 2 free unlocks Unlock quizzes for free by uploading documents![]()
![]()

