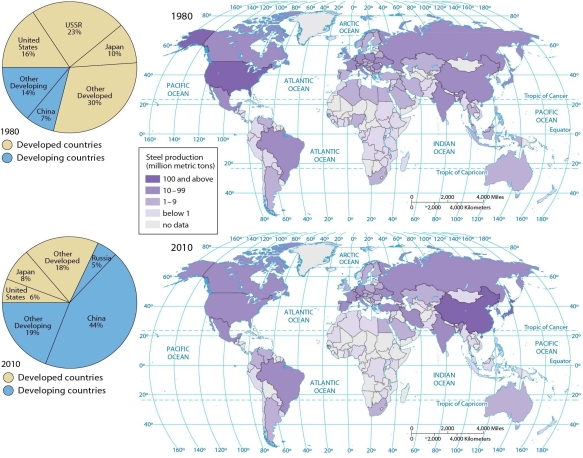
-According to these pie charts, between 1980 and 2010 the share of global steel production from developing countries
A) increased from 7 percent to 44 percent.
B) increased from 14 percent to 19 percent of the total, if Russia is considered a developing country.
C) increased from 5 percent to 23 percent of the total, if Russia is considered a developing country.
D) decreased from 68 percent to 21 percent, if Russia is considered a developing country.
E) increased from 21 percent to 68 percent of the total, if Russia is considered a developing country.
Correct Answer:
Verified
Q46: Q47: As a country's per capita income increases, Q48: Q49: Containerization was developed to facilitate long-distance transport Q50: Despite the risks to the environment, the Q52: Although transportation costs rise because breaks in Unlock this Answer For Free Now! View this answer and more for free by performing one of the following actions Scan the QR code to install the App and get 2 free unlocks Unlock quizzes for free by uploading documents![]()
![]()

