Which describes the figure of logistic population growth shown in the graph? 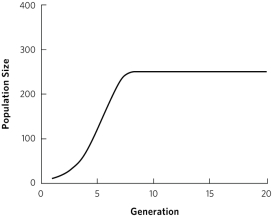
A) r > 0; K > 300
B) r < 0; K > 300
C) r > 0; K < 300
D) r < 0; K < 300
Correct Answer:
Verified
Q34: A park biologist is planting saplings (young
Q35: In the logistic growth model, in
Q36: The age structure of a population is
Q37: Which is the most accurate statement about
Q38: A biologist studies a population of birds
Q40: Using the logistic growth model, draw a
Q41: Explain the difference between positive density dependence
Q42: What is true about the life table
Q43: Consider a perennial plant with four
Q44: Applying life tables to sea turtle conservation
Unlock this Answer For Free Now!
View this answer and more for free by performing one of the following actions

Scan the QR code to install the App and get 2 free unlocks

Unlock quizzes for free by uploading documents