A biologist studies a population of birds for 25 years. Each year the biologist records the amount of rainfall and the density of birds (number of birds per 100 square meters). In addition, the biologist determines the survival rate for eggs laid that year. The biologist then plots egg survival rate against both rainfall (graph a) and density (graph b). In each plot the individual points represent the data for one year of the study. Based on these data, does this population of birds appear to be subject to positive density-dependent population regulation, negative density-dependent population regulation, or density-independent population regulation? As part of your answer, list the prediction for each type of population regulation and explain whether the data meet that prediction. 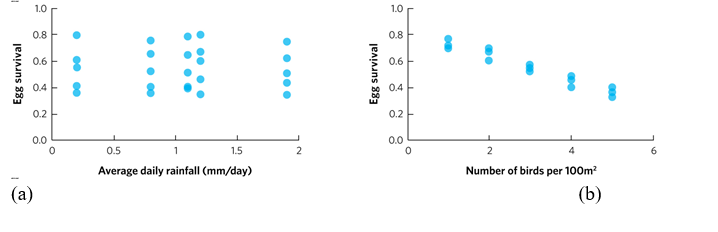
Correct Answer:
Verified
Q33: Alpine ibex are a type of wild
Q34: A park biologist is planting saplings (young
Q35: In the logistic growth model, in
Q36: The age structure of a population is
Q37: Which is the most accurate statement about
Q39: Which describes the figure of logistic population
Q40: Using the logistic growth model, draw a
Q41: Explain the difference between positive density dependence
Q42: What is true about the life table
Q43: Consider a perennial plant with four
Unlock this Answer For Free Now!
View this answer and more for free by performing one of the following actions

Scan the QR code to install the App and get 2 free unlocks

Unlock quizzes for free by uploading documents