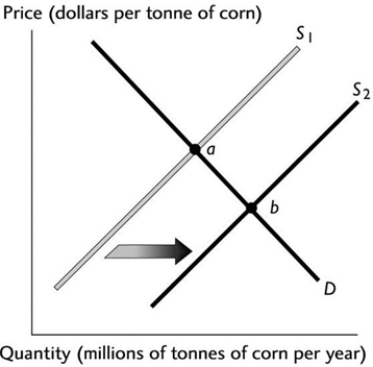
 The above figure illustrates the market for corn. If point 'a' represents the original equilibrium and point 'b' the new equilibrium, which of the following could have caused the change?
A) An increase in consumers' preferences for corn.
B) An increase in the labour costs of producing corn.
C) An increase in consumers' income if corn is a normal good.
D) An improvement in the technology of producing corn.
E) An increase in consumers' income if corn is an inferior good.
Correct Answer:
Verified
Q61: If a higher price for wheat decreases
Q62: Suppose over the next few years the
Q63: Researchers have found a hybrid of corn
Q64: Q65: Q67: One reason supply curves have an upward Q68: Which of the following shifts the supply Q69: A rise in the price of a Q70: Wheat is used to produce cereal. When Q71: Unlock this Answer For Free Now! View this answer and more for free by performing one of the following actions Scan the QR code to install the App and get 2 free unlocks Unlock quizzes for free by uploading documents![]()
![]()
![]()

