Multiple Choice
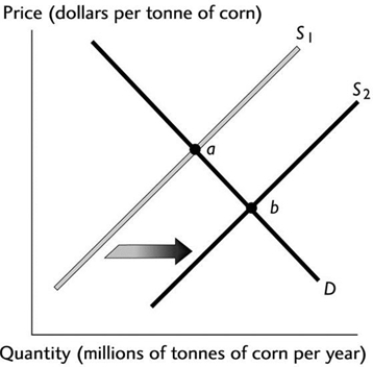 The above figure illustrates the market for corn. If point 'a' represents the original equilibrium and point 'b' the new equilibrium, which of the following could have caused the change?
A) An increased belief among buyers that corn is healthy.
B) A decrease in buyers' incomes if corn is an inferior good.
C) A decrease in the price of wheat, a substitute in production for corn.
D) A decrease in the number of corn growers.
E) An increase in the cost of the seed used to grow the corn.
Correct Answer:
Verified
Related Questions

