Multiple Choice
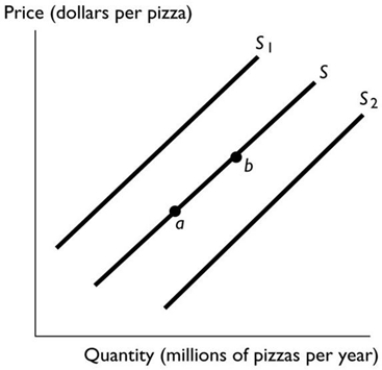 In the above figure, the shift in the supply curve from S to S1 reflects
A) an increase in the quantity of pizza supplied.
B) a decrease in the supply of pizza.
C) an increase in the supply of pizza.
D) a decrease in the quantity of pizza supplied.
E) None of the above answers is correct.
Correct Answer:
Verified
Related Questions
Q71: Q72: Q73: Q74: Advances in productivity increase supply because they![]()
![]()
![]()

