Multiple Choice
 In the above figure, an increase in cost of the cheese used to produce pizza
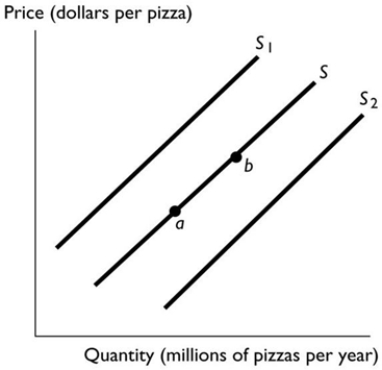
A) results in a movement from point b to point a.
B) results in a movement from point a to point b.
C) shifts the supply curve from S to S2.
D) shifts the supply curve from S to S1.
E) has no effect.
Correct Answer:
Verified
Related Questions
Q70: Wheat is used to produce cereal. When

