Multiple Choice
 In the above figure, the movement from point a to point b reflects
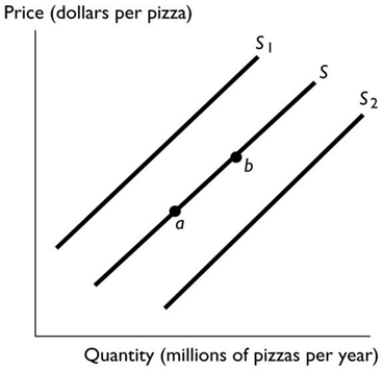
A) an increase in the number of producers of pizza.
B) a decrease in the cost of the tomato sauce used to produce pizza.
C) a decrease in income if pizza is a normal good.
D) an increase in the supply of pizza.
E) an increase in the price of pizza.
Correct Answer:
Verified
Related Questions
Q67: One reason supply curves have an upward
Q68: Which of the following shifts the supply
Q69: A rise in the price of a
Q70: Wheat is used to produce cereal. When

