Multiple Choice
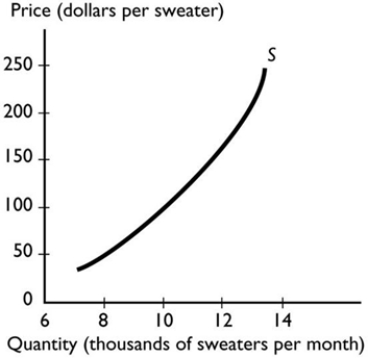 The graph illustrates the supply of sweaters. As the technology used to produce sweaters improves, the
A) quantity of sweaters supplied decreases.
B) quantity of sweaters supplied increases.
C) supply of sweaters decreases and the demand for sweaters does not change.
D) supply of sweaters increases AND the demand for sweaters increases.
E) supply of sweaters increases and the demand for sweaters does not change.
Correct Answer:
Verified
Related Questions
Q87: Assume a competitive market is in equilibrium.
Q88: Q89: Market equilibrium i. can never occur because![]()

