Multiple Choice
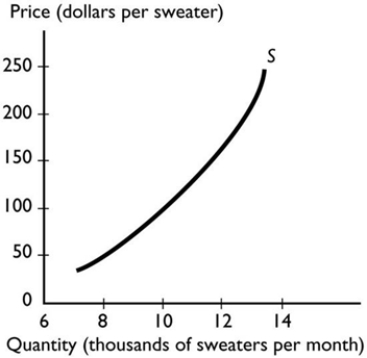 The graph illustrates the supply of sweaters. A fall in the price of sweaters brings
A) a movement along the supply curve.
B) a decrease in the quantity supplied of sweaters.
C) a shift of the supply curve.
D) Both answers A and B are correct.
E) Both answers B and C are correct.
Correct Answer:
Verified
Related Questions
Q90: Q91: Q92: Q93: If a market begins in equilibrium and Q94: If there is a surplus of tacos, Q96: If the price is below the equilibrium Q97: Using the data in the table above, Unlock this Answer For Free Now! View this answer and more for free by performing one of the following actions Scan the QR code to install the App and get 2 free unlocks Unlock quizzes for free by uploading documents![]()
![]()
![]()

