The following diagrams show the production possibilities boundaries for Austria and Switzerland,for the production of bicycles and shoes. 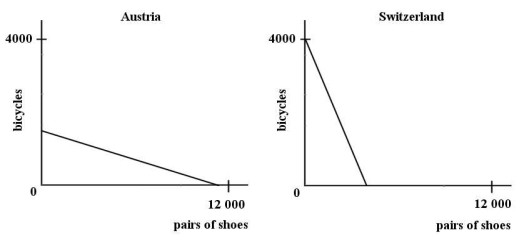 FIGURE 32-2 Refer to Figure 32-2.The diagrams illustrate that the ________ is lower in Austria than in Switzerland.
A) opportunity cost of producing shoes
B) opportunity cost of producing bicycles
C) total cost of producing shoes
D) average cost of producing bicycles
E) comparative advantage in producing bicycles
Correct Answer:
Verified
Q19: The existence of any "gains from trade"
Q20: If a country is not engaged in
Q21: If two countries each produce wool and
Q22: Consider the possibility of trade between countries.When
Q23: If Country A has a comparative advantage
Q25: The following diagrams show the production possibilities
Q26: The following diagrams show the production possibilities
Q27: Suppose two countries each produce wool and
Q28: The following diagrams show the production possibilities
Q29: Ireland and Japan are assumed to produce
Unlock this Answer For Free Now!
View this answer and more for free by performing one of the following actions

Scan the QR code to install the App and get 2 free unlocks

Unlock quizzes for free by uploading documents