This table shows how much wine and cheese can each be produced in Spain and Portugal with one unit of equivalent resources.Initially there is no trade.Once trade opens up,transportation costs are assumed to be zero. 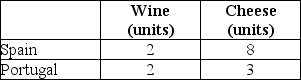 TABLE 32-5 Refer to Table 32-5.The comparative advantage in cheese is held by
A) Spain.
B) Portugal.
C) both countries.
D) neither country.
E) Insufficient information to know.
Correct Answer:
Verified
Q72: This table shows how much cotton and
Q73: The diagram below shows Robinson Crusoe's annual
Q74: This table shows how much wine and
Q75: The diagram below shows Robinson Crusoe's annual
Q76: This table shows how much cotton and
Q78: The diagram below shows Robinson Crusoe's annual
Q79: The figure below shows Arcticland's annual production
Q80: This table shows how much cotton and
Q81: International trade permits a country to
A)produce and
Q82: The diagram below shows the domestic demand
Unlock this Answer For Free Now!
View this answer and more for free by performing one of the following actions

Scan the QR code to install the App and get 2 free unlocks

Unlock quizzes for free by uploading documents