The diagram below shows the budget deficit function for a government in a hypothetical economy. 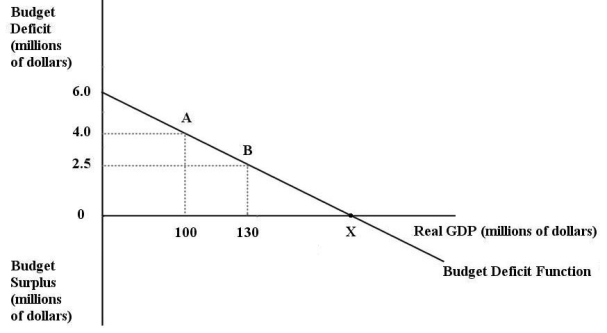 FIGURE 31-1 Refer to Figure 31-1.Initially,suppose real GDP is $100 million and the budget deficit is $4 million,as shown by point A on the graph.Which of the following is consistent with a move from point A to point B?
A) implementation of an expansionary fiscal policy
B) implementation of a contractionary fiscal policy
C) implementation of a contractionary monetary policy
D) the economy entering into a recession
E) the economy entering into a boom
Correct Answer:
Verified
Q39: The table below shows government purchases (G),net
Q40: The Canadian federal government's net debt as
Q41: The diagram below shows two budget deficit
Q42: The budget deficit function is graphed with
Q43: The diagram below shows two budget deficit
Q45: Consider the government's budget deficit function,graphed with
Q46: Consider the government's budget deficit function.If the
Q47: The diagram below shows two budget deficit
Q48: Consider the government's budget deficit function over
Q49: Consider the budget deficit function.With an unchanged
Unlock this Answer For Free Now!
View this answer and more for free by performing one of the following actions

Scan the QR code to install the App and get 2 free unlocks

Unlock quizzes for free by uploading documents