The diagram below shows two budget deficit functions for a hypothetical economy. 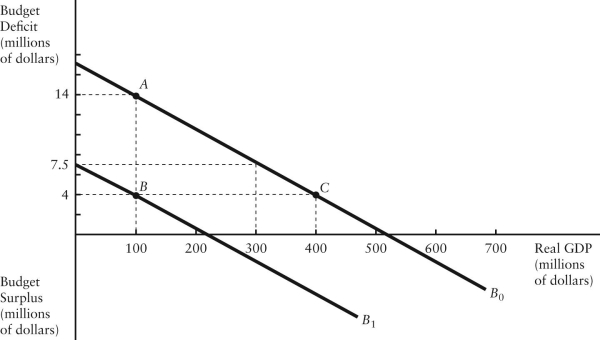 FIGURE 31-2 Refer to Figure 31-2.Initially,suppose the economy is at point A on budget deficit function
  .Real GDP (Y) is $100 million.If the level of potential output (Y*) were $300 million,the structural budget deficit would be
A) $4 million.
B) $6.5 million.
C) $7.5 million.
D) $14 million.
E) Insufficient information to know.
Correct Answer:
Verified
Q38: In every year between 1998 and 2008,the
Q39: The table below shows government purchases (G),net
Q40: The Canadian federal government's net debt as
Q41: The diagram below shows two budget deficit
Q42: The budget deficit function is graphed with
Q44: The diagram below shows the budget deficit
Q45: Consider the government's budget deficit function,graphed with
Q46: Consider the government's budget deficit function.If the
Q47: The diagram below shows two budget deficit
Q48: Consider the government's budget deficit function over
Unlock this Answer For Free Now!
View this answer and more for free by performing one of the following actions

Scan the QR code to install the App and get 2 free unlocks

Unlock quizzes for free by uploading documents