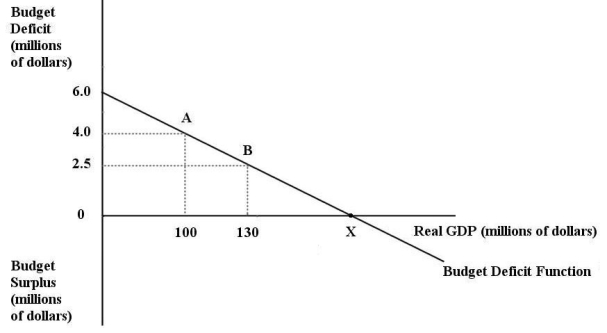
The diagram below shows the budget deficit function for a government in a hypothetical economy.  FIGURE 31-1 Refer to Figure 31-1.Initially,suppose real GDP is $100 million and the budget deficit is $4 million,as shown by point A.If the government implements an expansionary fiscal policy by increasing its purchases of goods and services,then
A) the budget deficit function would shift down.
B) the budget deficit function would become steeper.
C) the budget deficit function would become flatter.
D) the budget deficit function would shift up.
E) the size of the budget deficit would decrease as we move from point A to point B.
Correct Answer:
Verified
Q53: The diagram below shows two budget deficit
Q54: Consider the government's budget deficit function.With an
Q55: The diagram below shows two budget deficit
Q56: The diagram below shows the budget deficit
Q57: Suppose the government's budget deficit falls from
Q59: The diagram below shows two budget deficit
Q60: Consider the government's budget deficit function,graphed with
Q61: Consider a government with a positive stock
Q62: The best measure of the change in
Q63: The data below provides the Actual and
Unlock this Answer For Free Now!
View this answer and more for free by performing one of the following actions

Scan the QR code to install the App and get 2 free unlocks

Unlock quizzes for free by uploading documents