The diagram below shows two budget deficit functions for a hypothetical economy. 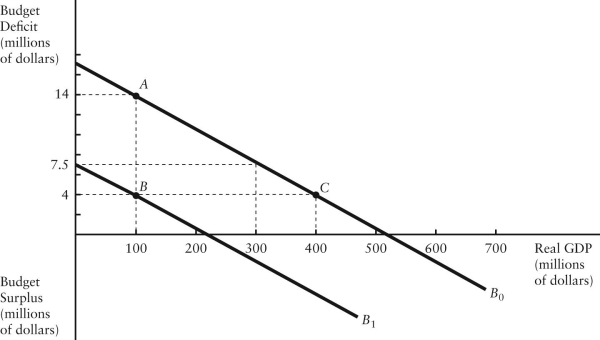 FIGURE 31-2 Refer to Figure 31-2.Initially,suppose the economy is at point A on budget deficit function
  .Real GDP (Y) is $100 million.If the level of potential output (Y*) were $300 million,the structural budget deficit would be
A) $2 million.
B) $14 million.
C) measured by the vertical distance between the horizontal axis and  (at real GDP = 300) .
D) measured by the vertical distance between point A and the budget deficit that would exist at real GDP = 300 million.
E) Insufficient information to know.
Correct Answer:
Verified
Q48: Consider the government's budget deficit function over
Q49: Consider the budget deficit function.With an unchanged
Q50: Consider the government's budget deficit function.Other things
Q51: The diagram below shows the budget deficit
Q52: As of 2018 the Canadian federal government
Q54: Consider the government's budget deficit function.With an
Q55: The diagram below shows two budget deficit
Q56: The diagram below shows the budget deficit
Q57: Suppose the government's budget deficit falls from
Q58: The diagram below shows the budget deficit
Unlock this Answer For Free Now!
View this answer and more for free by performing one of the following actions

Scan the QR code to install the App and get 2 free unlocks

Unlock quizzes for free by uploading documents