The diagram below shows two budget deficit functions for a hypothetical economy. 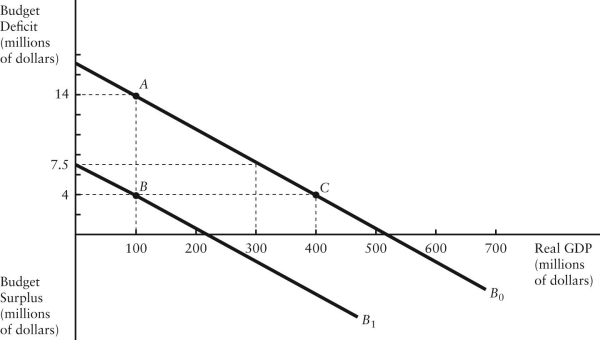 FIGURE 31-2 Refer to Figure 31-2.Initially,suppose the economy is at point A on budget deficit function
  .Real GDP (Y) is $100 million.If the level of potential output (Y*) were $300 million,how much of the actual budget deficit is due to the underlying structure of fiscal policy and is therefore independent of the current level of GDP?
A) $4 million
B) $6.5 million
C) $7.5 million
D) $14 million
E) Insufficient information to know
Correct Answer:
Verified
Q62: The best measure of the change in
Q63: The data below provides the Actual and
Q64: Suppose the change in the government's debt-to-GDP
Q65: The data below provides the Actual and
Q66: If the economy goes into a recession,the
Q68: The diagram below shows two budget deficit
Q69: Consider changes in the government's debt-to-GDP ratio.Suppose
Q70: The data below provides the Actual and
Q71: The data below provides the Actual and
Q72: Suppose the government's actual budget deficit is
Unlock this Answer For Free Now!
View this answer and more for free by performing one of the following actions

Scan the QR code to install the App and get 2 free unlocks

Unlock quizzes for free by uploading documents