The three figures below show the phases of a disinflation.In part (i) ,the economy is experiencing a sustained inflation at E1. 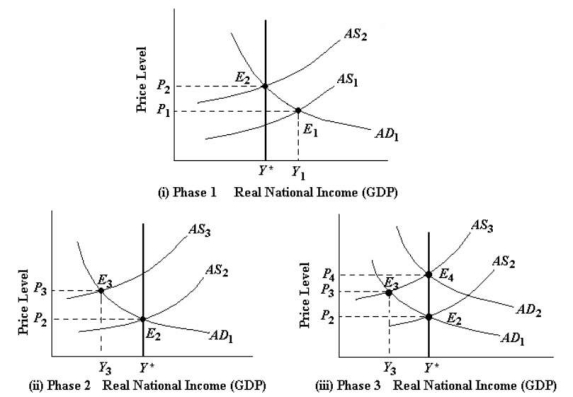 FIGURE 29-4 Refer to Figure 29-4,part (ii) .The upward shift of the AS curve in Phase 2 is normally caused by
A) workers accepting a reduction in their wages.
B) an increase in the productivity of workers.
C) the Bank of Canada engaging in an expansionary monetary policy.
D) an increase in the unemployment rate.
E) inflationary expectations that cause wages to continue rising.
Correct Answer:
Verified
Q95: Suppose the central bank is using monetary
Q96: According to the "acceleration hypothesis," the inflation
Q97: The three figures below show the phases
Q98: The three figures below show the phases
Q99: The statement that "inflation is always and
Q101: The sacrifice ratio is a measure of
Q102: A contractionary monetary policy that has been
Q103: Consider an economy that is in the
Q104: Consider the process of disinflation.A measure that
Q105: If a central bank is to successfully
Unlock this Answer For Free Now!
View this answer and more for free by performing one of the following actions

Scan the QR code to install the App and get 2 free unlocks

Unlock quizzes for free by uploading documents