The three figures below show the phases of a disinflation.In part (i) ,the economy is experiencing a sustained inflation at E1. 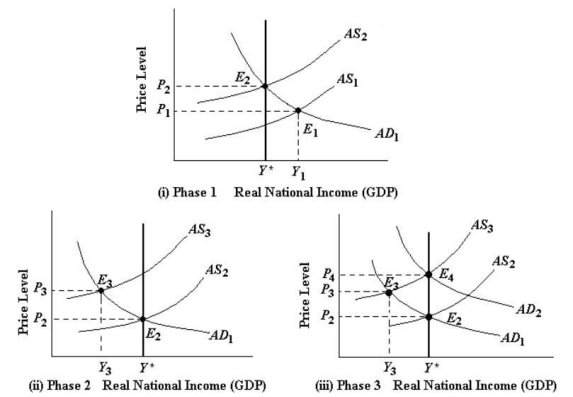 FIGURE 29-4 Refer to Figure 29-4,part (iii) .Consider the recovery phase of the disinflation process.The disadvantage of implementing an expansionary monetary policy to shift equilibrium from E3 to E4 is
A) the likelihood of entering a deflationary phase.
B) that since expected inflation has been eliminated,real wages will not adjust to any further AD or AS shocks.
C) a falling price level.
D) firms and consumers will no longer respond to decreases in interest rates.
E) the danger of reviving expected inflation,and having to repeat the phases of the disinflation.
Correct Answer:
Verified
Q92: Suppose we know the following information about
Q93: The three figures below show the phases
Q94: Consider the statement "inflation is always and
Q95: Suppose the central bank is using monetary
Q96: According to the "acceleration hypothesis," the inflation
Q98: The three figures below show the phases
Q99: The statement that "inflation is always and
Q100: The three figures below show the phases
Q101: The sacrifice ratio is a measure of
Q102: A contractionary monetary policy that has been
Unlock this Answer For Free Now!
View this answer and more for free by performing one of the following actions

Scan the QR code to install the App and get 2 free unlocks

Unlock quizzes for free by uploading documents