The three figures below show the phases of a disinflation.In part (i) ,the economy is experiencing a sustained inflation at E1. 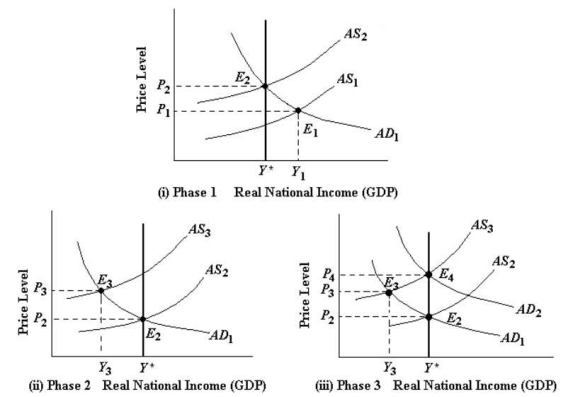 FIGURE 29-4 Refer to Figure 29-4,part (iii) .The movement of the economy from E3 to E4 in Phase 3 is often caused by
A) workers accepting a reduction in their wages.
B) an increase in the productivity of workers.
C) the Bank of Canada implementing an expansionary monetary policy.
D) an increase in the unemployment rate.
E) inflationary expectations that cause wages to continue rising.
Correct Answer:
Verified
Q85: The three figures below show the phases
Q86: Suppose we know the following information about
Q87: Suppose we know the following information about
Q88: The three figures below show the phases
Q89: The Phillips curve originally appeared to demonstrate
Q91: The idea that,in the long run,the Phillips
Q92: Suppose we know the following information about
Q93: The three figures below show the phases
Q94: Consider the statement "inflation is always and
Q95: Suppose the central bank is using monetary
Unlock this Answer For Free Now!
View this answer and more for free by performing one of the following actions

Scan the QR code to install the App and get 2 free unlocks

Unlock quizzes for free by uploading documents