The three figures below show the phases of a disinflation.In part (i) ,the economy is experiencing a sustained inflation at E1. 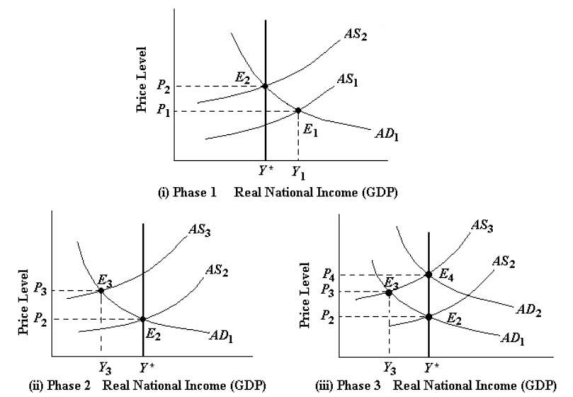 FIGURE 29-4 Refer to Figure 29-4,part (ii) or (iii) .A movement of the economy from E3 to E2 could be due to
A) a slow fall in wages due to the recessionary gap.
B) an expansionary monetary policy.
C) a contractionary monetary policy.
D) a rise in unit costs caused by falling wages.
E) a positive aggregate demand shock.
Correct Answer:
Verified
Q80: With regard to inflation,the "acceleration hypothesis" states
Q81: The Bank of Canada has formally adopted
Q82: The three figures below show the phases
Q83: The view that sustained inflation is possible
Q84: It is often said that inflation is
Q86: Suppose we know the following information about
Q87: Suppose we know the following information about
Q88: The three figures below show the phases
Q89: The Phillips curve originally appeared to demonstrate
Q90: The three figures below show the phases
Unlock this Answer For Free Now!
View this answer and more for free by performing one of the following actions

Scan the QR code to install the App and get 2 free unlocks

Unlock quizzes for free by uploading documents