The diagram below shows alternate paths for two hypothetical economies,each starting with GDP of $1 billion.Assume that Area 1 is equal to Area 2. 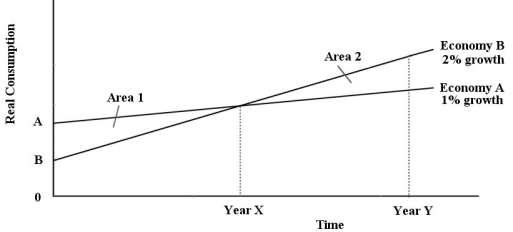 FIGURE 25-1 Refer to Figure 25-1.Which of the following statements best describes what we know about the difference between the two economies at Year 0?
A) Economy A has a higher level of real GDP at Year 0 than Economy B.
B) Economy B's households are consuming a larger percentage of GDP than Economy A's households.
C) There is no opportunity cost for economic growth for Economy B at Year 0.
D) There is no opportunity cost of economic growth for Economy A at Year 0.
E) Economy A's households are consuming a larger percentage of GDP than Economy B's households.
Correct Answer:
Verified
Q1: Consider the following table for a hypothetical
Q2: Over a long period of time,perhaps many
Q3: Of the variables listed below,the best measure
Q5: Suppose per capita GDP in a richer
Q6: Which of the following is implied by
Q7: If real income grows at approximately 4%
Q8: The diagram below shows alternate paths for
Q9: The diagram below shows alternate paths for
Q10: If real income grows at approximately 2%
Q11: Consider the following table for a hypothetical
Unlock this Answer For Free Now!
View this answer and more for free by performing one of the following actions

Scan the QR code to install the App and get 2 free unlocks

Unlock quizzes for free by uploading documents