The diagram below shows the market for financial capital in the long run when real GDP is equal to potential output,Y*. 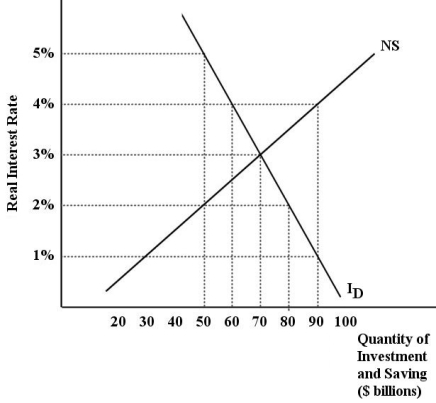 FIGURE 25-3 Refer to Figure 25-3.Suppose the interest rate in this market for financial capital is 2%.In this case there is an excess ________ financial capital of ________ billion dollars.
A) supply of; 30
B) demand for; -30
C) supply of; 50
D) demand for; 30
E) demand for; 80
Correct Answer:
Verified
Q73: In the Neoclassical growth model,whenever diminishing returns
Q74: The diagram below shows the market for
Q75: The diagram below show the market for
Q76: The diagram below shows the market for
Q77: In the Neoclassical growth model,increases in the
Q79: Data from most industrialized countries show that
Q80: The diagram below shows the market for
Q81: According to the Neoclassical growth model,balanced growth
Q82: According to the Neoclassical growth model,which of
Q83: An aggregate production function exhibits increasing returns
Unlock this Answer For Free Now!
View this answer and more for free by performing one of the following actions

Scan the QR code to install the App and get 2 free unlocks

Unlock quizzes for free by uploading documents