The diagram below shows the market for financial capital in the long run when real GDP is equal to potential output,Y*. 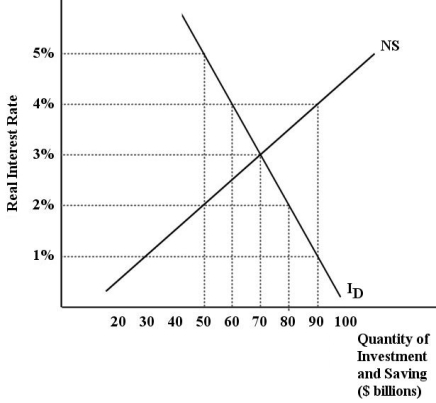 FIGURE 25-3 Refer to Figure 25-3.Suppose the interest rate in this market for financial capital is 2%.Which of the following statements correctly describes the adjustment that will occur in this market?
A) The excess supply of saving will push up the real interest rate,which will decrease the quantity demanded of investment and increase the quantity supplied of saving.
B) The excess demand for investment will push up the real interest rate,which will decrease the quantity demanded of investment and increase the quantity supplied of saving.
C) The excess supply of saving will push down the real interest rate,which will decrease the quantity demanded of investment and increase the quantity supplied of saving.
D) The excess demand for investment will push down the real interest rate,which will decrease the quantity demanded of investment and increase the quantity supplied of saving.
E) The excess demand for investment will push up the real interest rate,which will increase the quantity demanded of investment and decrease the quantity supplied of saving.
Correct Answer:
Verified
Q75: The diagram below show the market for
Q76: The diagram below shows the market for
Q77: In the Neoclassical growth model,increases in the
Q78: The diagram below shows the market for
Q79: Data from most industrialized countries show that
Q81: According to the Neoclassical growth model,balanced growth
Q82: According to the Neoclassical growth model,which of
Q83: An aggregate production function exhibits increasing returns
Q84: In Neoclassical growth theory,average material living standards
Q85: An aggregate production function,with both capital and
Unlock this Answer For Free Now!
View this answer and more for free by performing one of the following actions

Scan the QR code to install the App and get 2 free unlocks

Unlock quizzes for free by uploading documents