Multiple Choice
The table below shows total output for an economy over 3 years. 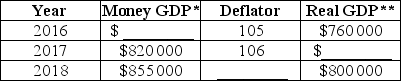 * millions of dollars ** real GDP measured in millions of 2010 dollars
TABLE 20-7
Refer to Table 20-7.The growth rate of real output from 2017 to 2018 is
A) 1.03%.
B) 1.84%.
C) 3.25%.
D) 3.41%.
E) 4.27%.
Correct Answer:
Verified
Related Questions
Q76: The table below includes data for a
Q77: The table below includes data for a
Q78: The table below includes data for a
Q79: Suppose nominal national income in some country
Q80: The table below includes data for a
Unlock this Answer For Free Now!
View this answer and more for free by performing one of the following actions

Scan the QR code to install the App and get 2 free unlocks

Unlock quizzes for free by uploading documents