Multiple Choice
The table below shows total output for an economy over 3 years. 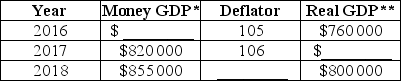 * millions of dollars ** real GDP measured in millions of 2010 dollars
TABLE 20-7
Refer to Table 20-7.The implicit GDP deflator for 2018 is approximately
A) 94.
B) 107.
C) 108.
D) 109.
E) 110.
Correct Answer:
Verified
Related Questions
Q81: The table below shows total output for
Q82: Q83: The table below shows total output for Q84: If nominal GDP in some year is Q85: The table below shows the total output![]()
Unlock this Answer For Free Now!
View this answer and more for free by performing one of the following actions

Scan the QR code to install the App and get 2 free unlocks

Unlock quizzes for free by uploading documents