The table below shows total output for an economy over 2 years. 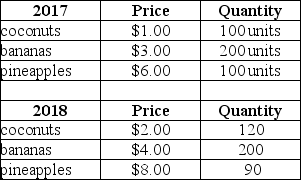 TABLE 20-8 Refer to Table 20-8.The implicit GDP deflator in 2018 (using 2017 as the base year) is
A) 71.59.
B) 100.
C) 103.4.
D) 114.6.
E) 139.7.
Correct Answer:
Verified
Q86: The table below shows total output for
Q87: Q88: The table below shows total output for Q89: The table below shows total output for Q90: The table below shows total output for Q92: The table below shows total output for Q93: The table below shows total output for Q94: The table below shows total output for Q95: The table below shows the total output Q96: The table below shows total output for![]()
Unlock this Answer For Free Now!
View this answer and more for free by performing one of the following actions

Scan the QR code to install the App and get 2 free unlocks

Unlock quizzes for free by uploading documents