The table below shows total output for an economy over 2 years. 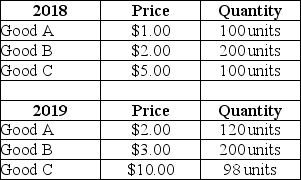 TABLE 20-5 Refer to Table 20-5.The implicit GDP deflator in 2019,when 2018 is used as the base year,was approximately
A) 105.
B) 160.
C) 180.
D) 193.
E) 203.
Correct Answer:
Verified
Q89: The table below shows total output for
Q90: The table below shows total output for
Q91: The table below shows total output for
Q92: The table below shows total output for
Q93: The table below shows total output for
Q95: The table below shows the total output
Q96: The table below shows total output for
Q97: The table below shows total output for
Q98: The table below shows total output for
Q99: The table below shows the total output
Unlock this Answer For Free Now!
View this answer and more for free by performing one of the following actions

Scan the QR code to install the App and get 2 free unlocks

Unlock quizzes for free by uploading documents