The table below shows total output for an economy over 2 years. 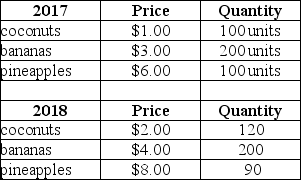 TABLE 20-8 Refer to Table 20-8.The nominal Gross Domestic Product in 2018 was
A) $1760.
B) $1500.
C) $1300.
D) $1260.
E) $410.
Correct Answer:
Verified
Q85: The table below shows the total output
Q86: The table below shows total output for
Q87: Q88: The table below shows total output for Q89: The table below shows total output for Q91: The table below shows total output for Q92: The table below shows total output for Q93: The table below shows total output for Q94: The table below shows total output for Q95: The table below shows the total output![]()
Unlock this Answer For Free Now!
View this answer and more for free by performing one of the following actions

Scan the QR code to install the App and get 2 free unlocks

Unlock quizzes for free by uploading documents