The table below shows hypothetical data for volumes of e-books and hardcover books sold over a 3-year period in a particular city. 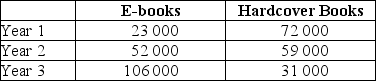 TABLE 2-3 Refer to Table 2-3.Suppose we choose Year 1 as the base year and construct a series of index numbers with which to analyze the sales data.The index numbers for volumes of e-books sold (starting with Year 1) is
A) 100; 44.2; 21.7.
B) 100; 226.1; 460.9.
C) 23 000; 52 000; 106 000.
D) 100; 126.1; 360.1.
E) 1; 0.442; 0.217.
Correct Answer:
Verified
Q54: The table below shows hypothetical tuition costs
Q55: If a theory's prediction is tested and
Q56: Most economists believe that economic analysis _
Q57: The table below shows hypothetical monthly cell
Q58: The table below shows hypothetical tuition costs
Q60: When testing theories,economics is disadvantaged compared to
Q61: The table below shows hypothetical data for
Q62: The table below shows hypothetical prices for
Q63: The table below shows hypothetical data for
Q64: The table below shows hypothetical data for
Unlock this Answer For Free Now!
View this answer and more for free by performing one of the following actions

Scan the QR code to install the App and get 2 free unlocks

Unlock quizzes for free by uploading documents