The table below shows hypothetical prices for a particular anatomy textbook at a university bookstore over several years. 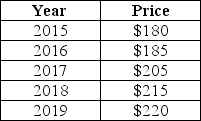 TABLE 2-4 Refer to Table 2-4.The increase in the price of the textbook from 2015 to 2019 is
A) -40.
B) 40.
C) 18.2%.
D) 22.2%.
E) 40%.
Correct Answer:
Verified
Q57: The table below shows hypothetical monthly cell
Q58: The table below shows hypothetical tuition costs
Q59: The table below shows hypothetical data for
Q60: When testing theories,economics is disadvantaged compared to
Q61: The table below shows hypothetical data for
Q63: The table below shows hypothetical data for
Q64: The table below shows hypothetical data for
Q65: The table below shows hypothetical data for
Q66: The table below shows the approximate value
Q67: The table below shows the approximate value
Unlock this Answer For Free Now!
View this answer and more for free by performing one of the following actions

Scan the QR code to install the App and get 2 free unlocks

Unlock quizzes for free by uploading documents