The diagram below shows two production possibilities boundaries for Country X. 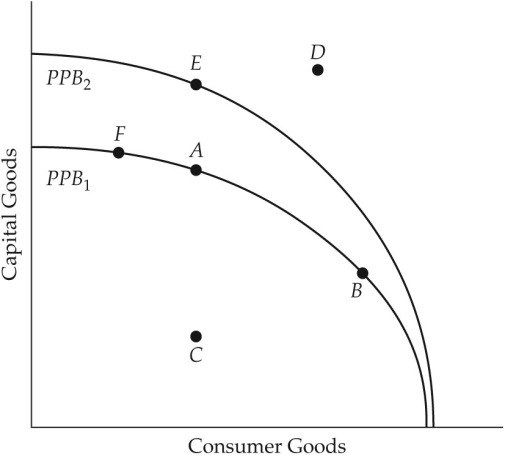 FIGURE 1-4 Refer to Figure 1-4.The production possibilities boundaries are drawn concave to the origin.What does this shape of the PPB demonstrate?
A) the decreasing opportunity cost of producing more of either good
B) the scarcity of resources in the economy
C) the constant opportunity cost of producing more of either good
D) the unfair distribution of resources in the economy
E) the increasing opportunity cost of producing more of either good
Correct Answer:
Verified
Q60: It has been observed that university enrollment
Q61: The diagram below shows two production possibilities
Q62: On a diagram of a production possibilities
Q63: Suppose there are only two goods produced
Q64: The diagram below shows two production possibilities
Q66: Consider the production possibilities boundary (PPB)of an
Unlock this Answer For Free Now!
View this answer and more for free by performing one of the following actions

Scan the QR code to install the App and get 2 free unlocks

Unlock quizzes for free by uploading documents