The diagram below shows two production possibilities boundaries for Country X. 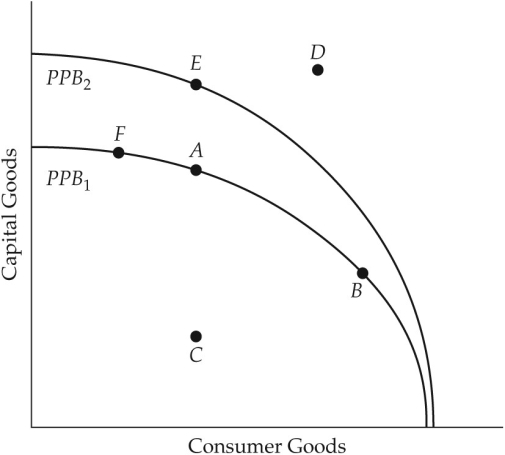 FIGURE 1-4 Refer to Figure 1-4.Growth in the country's productive capacity is illustrated by
A) a point like D outside the boundary.
B) a movement from a point inside the boundary such as C to the boundary.
C) the movement between points on a given boundary.
D) a single point such as A on the boundary.
E) an outward shift of the boundary,for example from PPB1 to PPB2.
Correct Answer:
Verified
Q59: During economic recessions,the opportunity cost of going
Q60: It has been observed that university enrollment
Q61: The diagram below shows two production possibilities
Q62: On a diagram of a production possibilities
Q63: Suppose there are only two goods produced
Q65: The diagram below shows two production possibilities
Q66: Consider the production possibilities boundary (PPB)of an
Unlock this Answer For Free Now!
View this answer and more for free by performing one of the following actions

Scan the QR code to install the App and get 2 free unlocks

Unlock quizzes for free by uploading documents