The diagram below shows two production possibilities boundaries for Country X. 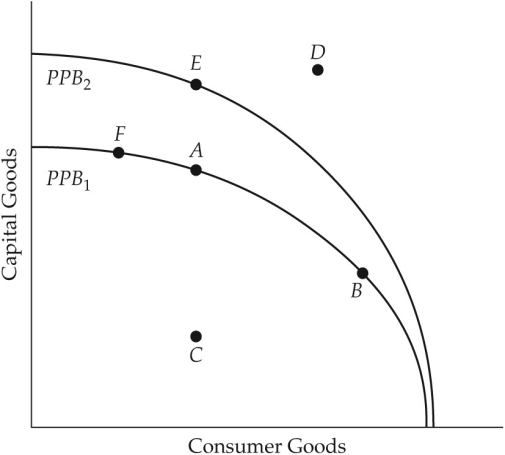 FIGURE 1-4 Refer to Figure 1-4.At point B,
A) the price of capital goods is higher than the price of consumer goods.
B) Country X is producing too many consumer goods and too few capital goods.
C) the price of consumer goods is equal to the price of capital goods.
D) the opportunity cost of producing an extra unit of capital goods is higher than at point A.
E) the opportunity cost of producing an extra unit of consumer goods is higher than at point A.
Correct Answer:
Verified
Q66: Consider the production possibilities boundary (PPB)of an
Q67: Q68: Q69: On a diagram of a production possibilities Q70: A straight-line production possibilities boundary differs from Q72: The diagram below shows two production possibilities Q73: The diagram below shows two production possibilities Q74: On a diagram of a production possibilities Q75: The diagram below shows two production possibilities Q76: The diagram below shows two production possibilities![]()
![]()
Unlock this Answer For Free Now!
View this answer and more for free by performing one of the following actions

Scan the QR code to install the App and get 2 free unlocks

Unlock quizzes for free by uploading documents