The diagram below shows two production possibilities boundaries for Country X. 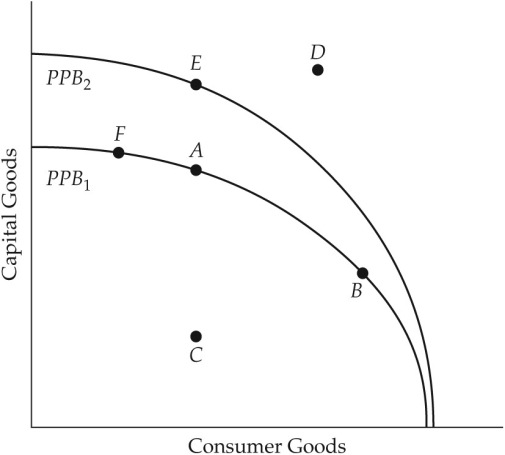 FIGURE 1-4 Refer to Figure 1-4.An outward shift of the production possibilities boundary from
  to
to  indicates which of the following?
A) an increase in the price of raw materials for consumer goods
B) growth in the country's productive capacity
C) an increase in the price of raw material for capital goods
D) more of the country's resources are being used
E) the country's resources are being used less efficiently
Correct Answer:
Verified
Q71: The diagram below shows two production possibilities
Q72: The diagram below shows two production possibilities
Q73: The diagram below shows two production possibilities
Q74: On a diagram of a production possibilities
Q75: The diagram below shows two production possibilities
Q77: The diagram below shows two production possibilities
Unlock this Answer For Free Now!
View this answer and more for free by performing one of the following actions

Scan the QR code to install the App and get 2 free unlocks

Unlock quizzes for free by uploading documents