The diagram below shows two production possibilities boundaries for Country X. 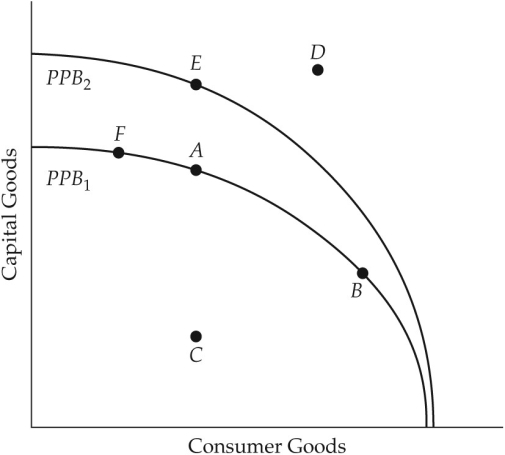 FIGURE 1-4 Refer to Figure 1-4.Suppose Country X is currently producing at point E.Country X could achieve production at point D if
A) the given resources were fully employed.
B) the given resources were more efficiently employed.
C) sufficient improvements in technology occurred in either the capital goods industry or the consumer goods industries.
D) firms reduced output of capital goods.
E) the prices of capital goods and consumption goods fell.
Correct Answer:
Verified
Q75: The diagram below shows two production possibilities
Q76: The diagram below shows two production possibilities
Q77: The diagram below shows two production possibilities
Q78: Q79: If there is always a three-for-one trade-off Q81: In recent years,several large Canadian-owned mining and Q82: Consider a production possibilities boundary showing the Q83: Figure 1-7 shows the production possibilities boundary Q84: Consider Canada's production possibilities boundary.Suppose fire destroys Q85: A move from inside the production possibilities![]()
Unlock this Answer For Free Now!
View this answer and more for free by performing one of the following actions

Scan the QR code to install the App and get 2 free unlocks

Unlock quizzes for free by uploading documents