Which of the lines on the figure below is the best representation of the relationship between the volume and the number of moles of a gas, measured at constant temperature and pressure? 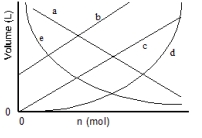
A) a
B) b
C) c
D) d
E) e
Correct Answer:
Verified
Q36: A weather balloon was initially at a
Q37: A sample of ammonia gas at 65.5°C
Q43: A sample of propane, a component of
Q49: A 500-mL sample of argon at 800
Q54: Assuming ideal behavior, what is the density
Q58: A sample container of carbon monoxide occupies
Q63: Lithium oxide is an effective absorber of
Q71: Methane, CH4(g), reacts with steam to give
Q78: Magnesium metal (0.100 mol) and a volume
Q80: What is the pressure in a 7.50-L
Unlock this Answer For Free Now!
View this answer and more for free by performing one of the following actions

Scan the QR code to install the App and get 2 free unlocks

Unlock quizzes for free by uploading documents