The graph below shows demand and marginal cost for a perfectly competitive firm.If the firm is producing 100 units of output,increasing output by one unit would ______ the firm's profit by $______. 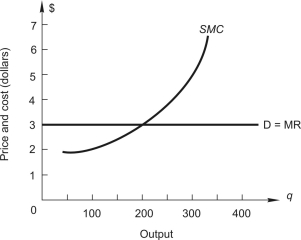
A) increase,$3
B) increase,$2
C) decrease,$1
D) increase,$1
E) decrease,$2
Correct Answer:
Verified
Q9: Which of the following is NOT a
Q10: The graph on the left shows the
Q11: The total cost schedule for a
Q12: The graph below on the left shows
Q13: A competitive firm will maximize profit by
Q15: In order to minimize losses in the
Q16: Total cost schedule for a competitive
Q17: When total fixed costs increase,
A)the profit-maximizing level
Q18: Total cost schedule for a competitive
Q19: Below,the graph on the left shows the
Unlock this Answer For Free Now!
View this answer and more for free by performing one of the following actions

Scan the QR code to install the App and get 2 free unlocks

Unlock quizzes for free by uploading documents