Below,the graph on the left shows the short-run cost curves for a firm in a perfectly competitive market,and the graph on the right shows the current market conditions in this industry.In order to maximize profit,how much output should the firm produce? 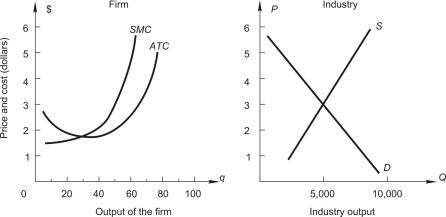
A) 20 units
B) 40 units
C) 50 units
D) 60 units
E) 80 units
Correct Answer:
Verified
Q14: The graph below shows demand and marginal
Q15: In order to minimize losses in the
Q16: Total cost schedule for a competitive
Q17: When total fixed costs increase,
A)the profit-maximizing level
Q18: Total cost schedule for a competitive
Q20: For a price-taking firm,marginal revenue
A)is the addition
Q21: The table below shows a competitive
Q22: A firm in a competitive industry faces
Q23: Q24: ![]()
![]()
Unlock this Answer For Free Now!
View this answer and more for free by performing one of the following actions

Scan the QR code to install the App and get 2 free unlocks

Unlock quizzes for free by uploading documents