Refer to the following figure.The price of capital is $50 per unit: 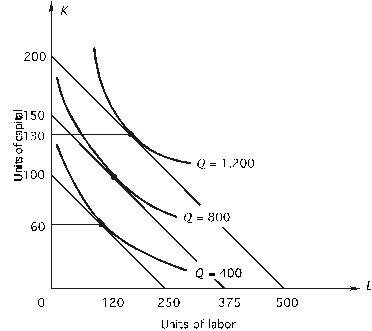 What is the marginal rate of technical substitution at each cost minimizing equilibrium point?
A) 0.80
B) 0.40
C) 2.50
D) 2.00
E) impossible to tell without marginal products
Correct Answer:
Verified
Q2: Which of the following is FALSE?
A)A change
Q3: Refer to the following figure.The price of
Q4: Refer to the following figure.The price of
Q5: Suppose that when a firm increases output
Q6: Refer to the following graph.The price of
Q8: Refer to the following figure.The price of
Q9: The marginal rate of technical substitution is
A)the
Q10: Refer to the following graph.The price of
Q11: Refer to the following figure.The price of
Q12: expansion path shows how
A)input prices change as
Unlock this Answer For Free Now!
View this answer and more for free by performing one of the following actions

Scan the QR code to install the App and get 2 free unlocks

Unlock quizzes for free by uploading documents