The figure below shows a consumer maximizing utility at two different prices (the left panel) and the consumer's demand for good X at the same two prices of good X (the right panel) .The price of good Y is $4.50.At point R on the demand curve for X,the price of X is $____. 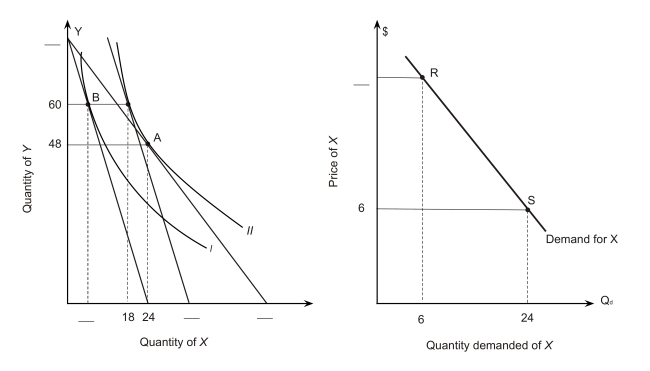
A) $8
B) $10
C) $12.50
D) $14
E) $15
Correct Answer:
Verified
Q83: The following figure shows a portion of
Q84: In the following figure,a consumer faces a
Q85: The figure below shows a consumer maximizing
Q86: The following figure shows a portion of
Q87: In a world with only two goods
Q89: The following figure shows a portion of
Q90: The following figure shows a portion of
Q91: The figure below shows a consumer maximizing
Q92: The figure below shows a consumer maximizing
Q93: The figure below shows a consumer maximizing
Unlock this Answer For Free Now!
View this answer and more for free by performing one of the following actions

Scan the QR code to install the App and get 2 free unlocks

Unlock quizzes for free by uploading documents